
Blog
Engagement Ring Statistics 2026

By Benjamin Khordipour, G.D., C.G.P.
Estate Diamond Jewelry has received more than 50,000 results through its engagement ring budget calculator. I wrote this report together with Afshin Shaddaie to explore what calculator entries reveal about center stone selections, income, existing debt, and lifestyle.
For this edition, we analyzed an available export of calculator results recorded through 2026. The findings describe this calculator audience and its recorded selections, offering a view of the financial circumstances surrounding engagement ring research.
Average Engagement Ring Spending in 2026
Estate Diamond Jewelry estimates an average engagement ring purchase budget of approximately $6,400 within the calculator records analyzed for this report. This estimate assumes that users spend the amounts recommended by the calculator.
For this calculation, we included positive saved budget recommendations associated with entered annual salaries between $10,000 and $1,000,000.
Our recommendation is to use these figures as context when considering your own budget. Your available savings, existing obligations, and the wearer’s preferences should determine what you spend.
Key Engagement Ring Statistics
| Finding | Share of entries |
|---|---|
| Reported some existing debt | 62.5% |
| Selected the Diamond option | 64.0% |
| Selected Lab Grown Diamond | 27.6% |
| Selected either diamond option | 91.6% |
| Described their lifestyle as average or modest | 78.9% |
| Selected Sapphire | 3.7% |
Percentages refer to recorded calculator entries, rather than verified purchases or unique buyers. The calculator lists “Diamond” separately from “Lab Grown Diamond.” Methodology and definitions appear below.
Which Center Stones Did Calculator Users Select?
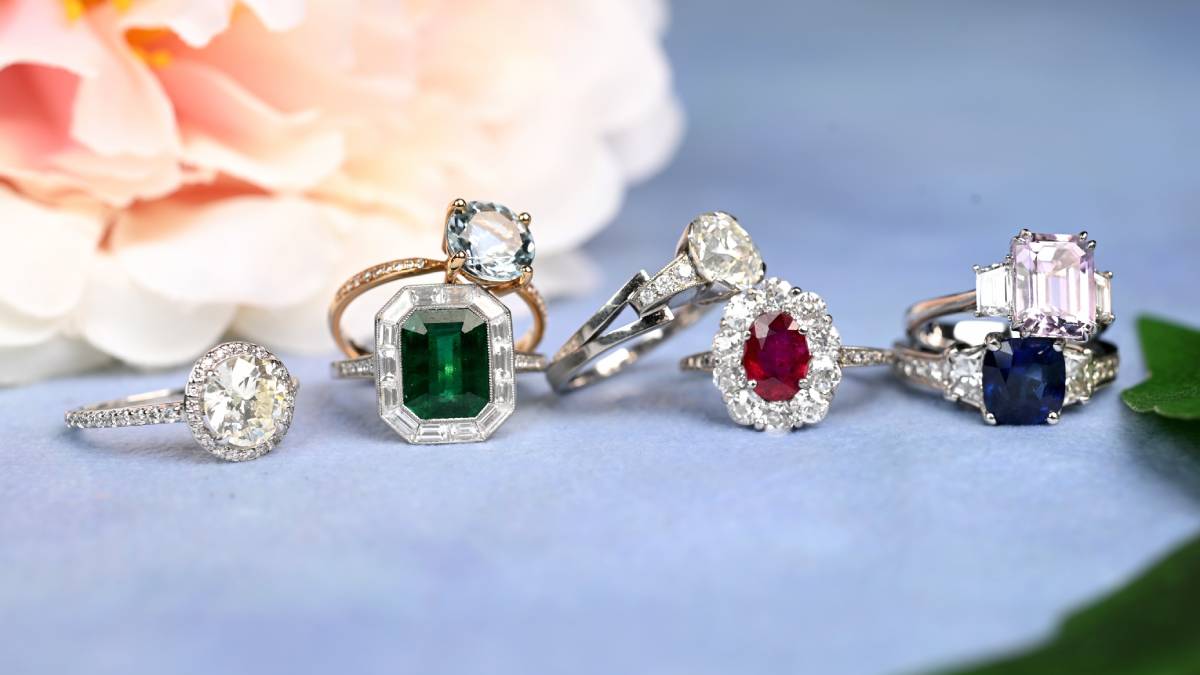
Diamonds accounted for most recorded center stone selections. The Diamond option represented 64.0% of entries, while Lab Grown Diamond represented 27.6%. Together, the two options accounted for 91.6% of selections.
| Center stone option | Share of all entries |
|---|---|
| Diamond | 64.0% |
| Lab Grown Diamond | 27.6% |
| Other | 3.9% |
| Sapphire | 3.7% |
| Cubic Zirconia | 0.5% |
| Aquamarine | 0.4% |
Among entries selecting one of the two diamond options, 30.1% selected lab-grown. That percentage has a different denominator from the 27.6% figure above, which includes every center stone option.
Sapphire led the specifically named non-diamond options offered by the calculator. However, Other was selected slightly more often than Sapphire. Because the form does not identify the stones within Other, this research cannot rank every alternative gemstone or measure demand for options the form did not list separately.
For a shopper, the useful question is which stone best matches the wearer’s preferences and intended use. A popularity percentage provides context, but choosing a suitable ring still requires examining the individual gemstone and setting.
How Lab-Grown Diamond Selections Differed by Income
Lab-grown diamond selection was more common in lower salary bands and declined across the higher bands.
Among eligible entries reporting annual salaries of $50,000 to under $100,000, 35.6% selected lab-grown diamonds. That share was 7.9% in the $250,000 to $1,000,000 band.
| Entered annual salary | Selected lab-grown diamond |
|---|---|
| $10,000 to under $50,000 | 37.0% |
| $50,000 to under $100,000 | 35.6% |
| $100,000 to under $150,000 | 26.1% |
| $150,000 to under $250,000 | 15.5% |
| $250,000 to $1,000,000 | 7.9% |
Each percentage is calculated within its salary band and includes all center stone options in that band.
For these comparisons, we limited salary inputs to $10,000 through $1,000,000 to reduce the influence of implausible or ambiguous entries. Results outside that range remain in the overall stone, debt, and lifestyle summaries.
The difference between the $50,000 to under $100,000 band and the highest band was 27.6 percentage points, calculated before rounding.
The data shows an association between entered salary and stone selection. It does not establish whether price, personal preference, the desired appearance, or another consideration drove the choice.
This distinction matters when interpreting engagement ring research. A percentage drawn from one salary mix may differ from a percentage drawn from another, even when both sets of observations are accurate.
How Much Existing Debt Did Calculator Users Report?
Existing debt appeared in 62.5% of entries. However, the answers distinguish between very little debt, average debt, and a lot of debt. Only 7.1% selected the highest debt category.
| Self-reported existing debt | Share of entries |
|---|---|
| No debt | 37.5% |
| Very little | 25.8% |
| Average | 29.6% |
| A lot | 7.1% |
These are subjective descriptions. The calculator does not establish dollar balances, interest rates, required payments, or whether the debt is a mortgage, student loan, credit card balance, or another obligation.
The finding also does not mean that 62.5% borrowed to buy an engagement ring. The question asks about existing debt. It cannot tell us how a ring was financed or whether a purchase eventually took place.
My recommendation is to review required payments and available savings before deciding on a ring budget. Two people with the same salary can have very different amounts available after their obligations. An income-based spending rule overlooks that difference.
Debt Was Also Reported in Higher Salary Bands
Higher entered salary did not imply an absence of existing debt.
Within the $100,000 to under $150,000 salary band, 62.9% reported some debt. The figure was 48.5% among eligible entries in the $250,000 to $1,000,000 band.
| Entered annual salary | Reported some existing debt |
|---|---|
| $10,000 to under $50,000 | 67.1% |
| $50,000 to under $100,000 | 68.0% |
| $100,000 to under $150,000 | 62.9% |
| $150,000 to under $250,000 | 54.0% |
| $250,000 to $1,000,000 | 48.5% |
“Some existing debt” combines the Very little, Average, and A lot categories. It is not a measure of financial distress.
These figures reinforce a narrower point: salary alone does not describe a person’s financial obligations.
How Lifestyle Descriptions Related to Stone Selections
The calculator asks users to describe the lifestyle they both have.
Average was the most common answer at 55.8%, followed by Modest at 23.1%, Upper Class at 18.6%, and Luxury at 2.5%.
Together, average and modest descriptions accounted for 78.9% of entries.
Lab-grown diamond selections also differed across these lifestyle categories.
| Self-described lifestyle | Selected lab-grown diamond |
|---|---|
| Modest | 35.7% |
| Average | 28.8% |
| Upper Class | 16.6% |
| Luxury | 7.2% |
Lab-grown selection declined across the more affluent lifestyle descriptions, following the broad pattern seen in the salary comparison.
However, lifestyle is self-defined, and its relationship with income means these findings should not be treated as two independent explanations of stone choice.
The calculator did not ask why a stone was selected. We therefore cannot conclude that one group cared more about sustainability, resale value, tradition, or any other motivation.
What the Findings Mean for Your Engagement Ring Budget
The practical value of this research is that it places ring decisions in the context of other financial commitments. A salary figure, a national spending average, or another person’s purchase provides only part of the picture.
Start with an amount that fits your available funds and obligations. Then identify the features that matter most to the person wearing the ring. Those preferences will make it easier to compare actual options within a comfortable budget.
For an antique or vintage ring, examine the condition and construction of the individual piece, its stone documentation, and whether its proportions and design suit the wearer.
A calculator recommendation can help begin that conversation. It should remain a guide rather than a spending target that someone feels obliged to reach.
To explore your own circumstances, use our engagement ring budget calculator.
How This Research Was Conducted

This report uses an available export from Estate Diamond Jewelry’s larger calculator collection. The analyzed records were dated through 2026. The percentages describe that export rather than an analysis of the full historical archive.
The main fields were entered annual salary, self-described lifestyle, vacation frequency, existing debt, and center stone selection. Overall percentages use entries containing the relevant answer. Salary comparisons use inputs from $10,000 through $1,000,000 and calculate each percentage within the stated band.
The unit of analysis is a calculator entry. A person may run the calculator more than once or explore different scenarios, so entries should not be interpreted as unique individuals.
A separate sensitivity check consolidated likely repeat calculations using matching network, browser, and device information within a 30-minute window. The overall debt and lab-grown selection findings remained within approximately 1.2 percentage points of the reported results. This check cannot establish unique identities.
Users are self-selected visitors to a jewelry retailer’s calculator. Their answers are not independently verified, and the export does not establish a U.S.-only population. The research is not nationally representative and does not measure completed purchases, actual spending, age, or reasons for selecting a stone. No national population weighting or probability-sample margin of error is applied.
Percentages are rounded to one decimal place, so displayed totals may differ slightly from 100%.
Frequently Asked Questions
1. What percentage of entries reported existing debt?
Some existing debt was reported in 62.5% of analyzed calculator entries. The category describing a lot of debt accounted for 7.1%. Neither figure measures borrowing to purchase a ring.
2. What percentage selected lab-grown diamonds?
Lab Grown Diamond was selected in 27.6% of all analyzed entries. Among entries selecting one of the two diamond options, the lab-grown share was 30.1%.
3. Which named non-diamond stone was selected most often?
Sapphire was the most frequently selected specifically named non-diamond option, accounting for 3.7% of all entries. The Other category accounted for 3.9%, but its individual gemstones were not identified.
Citing This Research
Please attribute these findings to Estate Diamond Jewelry’s Engagement Ring Statistics 2026 report by Benjamin Khordipour.
When quoting a percentage, identify it as a finding from calculator entries and preserve any relevant income band or other subgroup.
Link to the original report so readers can review its definitions and methodology.
For questions about the findings or help comparing rings, contact our team.
